Bollinger Bands on PSX: How to Spot Breakouts and Breakdowns Before They Happen
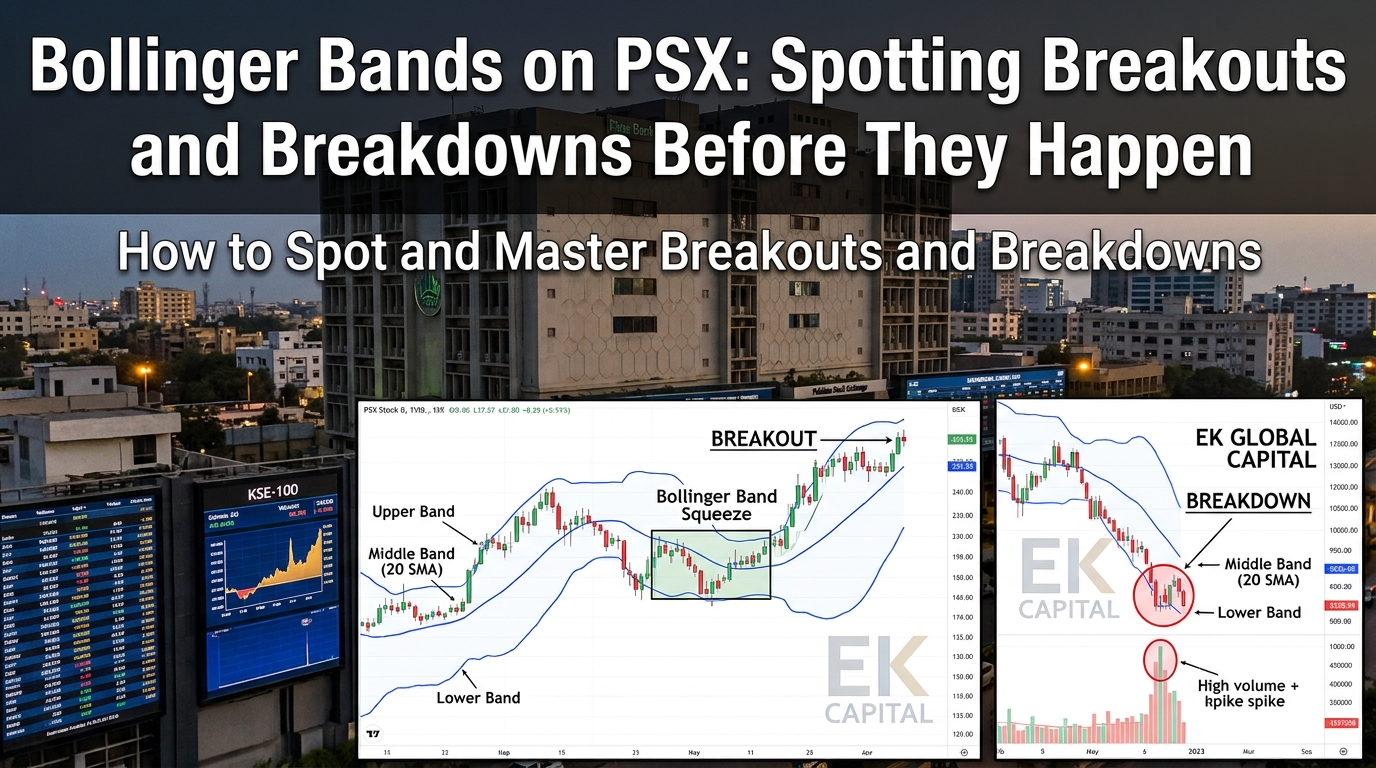
Bollinger Bands are one of the most visually intuitive indicators on a chart. Two lines wrapping around price, expanding and contracting as volatility rises and falls. Most PSX retail traders read them as "support and resistance" — buy when price hits the lower band, sell when it hits the upper. That's wrong, and that misreading is why the bands feel unreliable to most people.
Bollinger Bands are one of the most visually intuitive indicators on a chart. Two lines wrapping around price, expanding and contracting as volatility rises and falls. Most PSX retail traders read them as "support and resistance" — buy when price hits the lower band, sell when it hits the upper. That's wrong, and that misreading is why the bands feel unreliable to most people.
This guide covers what Bollinger Bands actually measure, the setup that produces the highest-quality PSX signals, and real data from EK Global Capital's BREAKDOWN signal — which has an astonishing 91% lifetime win rate.
What Bollinger Bands actually measure Bollinger Bands are calculated using three lines:
Middle band: 20-period simple moving average (SMA) Upper band: middle band + (2 × standard deviation of price) Lower band: middle band − (2 × standard deviation of price) The bands don't measure support or resistance — they measure volatility. When volatility is low, standard deviation shrinks and bands narrow. When volatility spikes, bands expand.
Roughly 95% of price action statistically falls within 2 standard deviations of the mean, so when price touches or crosses a band, it's a volatility event, not necessarily a reversal. That distinction is why simple "touch the band = fade" strategies lose money.