AI-Enhanced Technical Analysis: Smart Chart Reading for PSX Traders
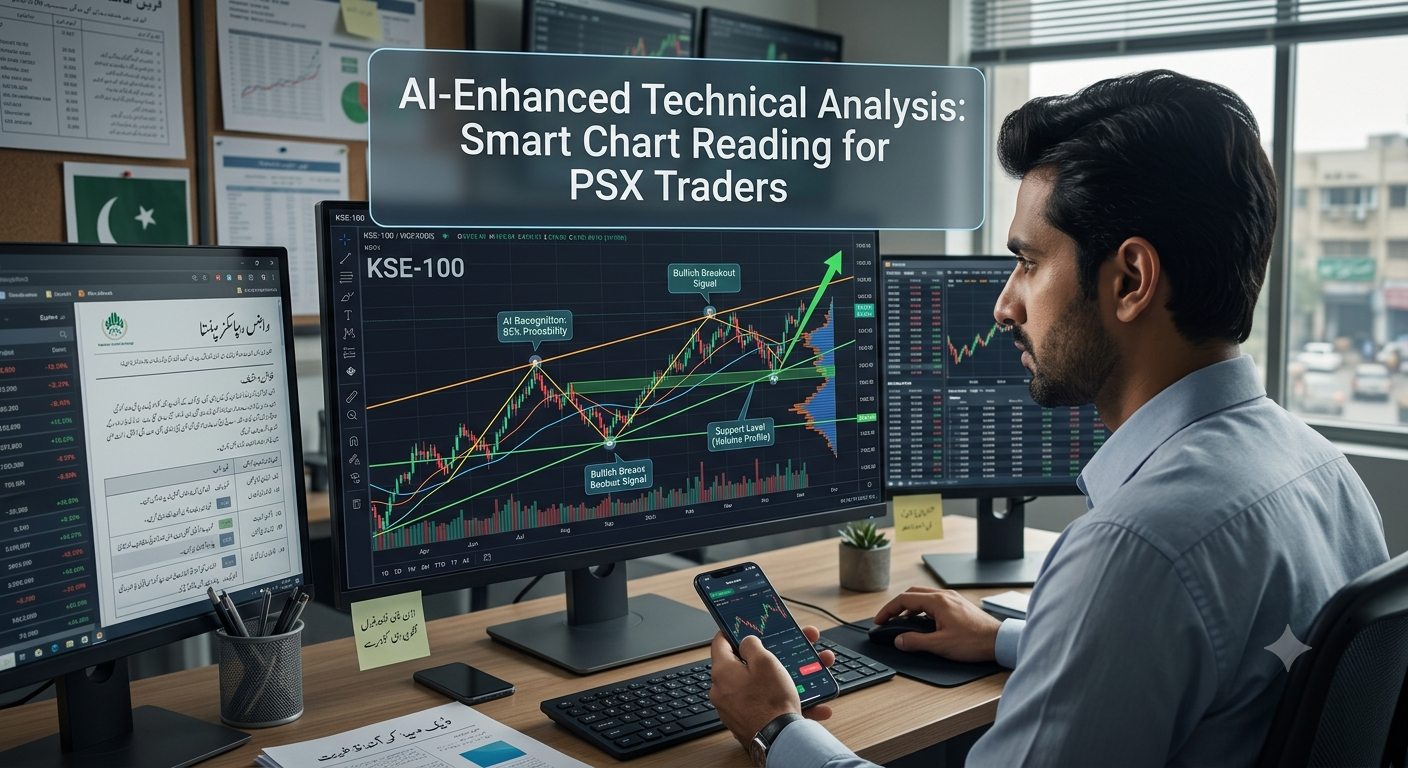
The Pakistan Stock Exchange (PSX) has long been a barometer of the nation's economic health, a battleground for institutional bulls, and a hunting ground for retail traders seeking alpha. For decades, the tools of the trade remained static: trendlines drawn by hand, RSI levels calculated on spreadsheets, and gut feelings driving split-second decisions. However, a paradigm shift is underway.
The Pakistan Stock Exchange (PSX) has long been a barometer of the nation's economic health, a battleground for institutional bulls, and a hunting ground for retail traders seeking alpha. For decades, the tools of the trade remained static: trendlines drawn by hand, RSI levels calculated on spreadsheets, and gut feelings driving split-second decisions. However, a paradigm shift is underway.
The integration of Artificial Intelligence (AI) into technical analysis is revolutionizing how PSX traders interpret charts, identify patterns, and execute trades. This is not just about faster computing; it is about a fundamental change in chart reading—moving from subjective human interpretation to objective, data-driven pattern recognition.
This comprehensive guide explores the intersection of AI and technical analysis specifically for the Pakistan Stock Exchange. We will delve into how AI is enhancing traditional tools like candlestick patterns, moving averages, and support/resistance levels, providing PSX traders with a significant edge in a volatile and often unpredictable market.
The Evolution of Technical Analysis in Pakistan Technical analysis in Pakistan has traversed a fascinating journey. In the early days of the PSX (formerly the KSE), analysis was rudimentary. Traders relied on physical ticker tapes and hand-drawn charts. The "guru" was often the broker with the most experience, reading price action through intuition.
The 2000s brought the digital revolution. Platforms like Metastock and Amibroker became staples. Pakistani traders began adopting classic Western methodologies—Elliot Wave, Gann Angles, and standard indicators like MACD and RSI.